
For the full, public report please view the the Kalamazoo College Carbon Report submitted through The University of New Hampshire’s SIMAP carbon and nitrogen-accounting platform.
Introduction
The Kalamazoo College Sustainability and Climate Action Plan is a framework designed to envision, measure, and reduce greenhouse gas emissions and related impacts of Kalamazoo College on the climate. It was written by committee and signed in January 2010, a 28-month project that began as a student-led initiative following President Wilson-Oyelaran’s signing of the American College & University Presidents Climate Commitment in 2007. The plan contains interim goals for 2015 but the overarching goal is a reduction of greenhouse gas emissions from campus operations to 25% below 2008 levels by the year 2020, and complete climate neutrality by 2050. In order to track whether the College has reached its goals, the plan requires yearly tracking of our carbon data. Unfortunately, this is the first Carbon report since 2014 and, thus, will serve as the baseline for the future revision of the current Climate Action Plan which will make new goals for the next five years. This 2018-2019 Carbon report was generated by the current Sustainability Interns for Facilities Management, Dana Schau and Madeline Ward, and the members of the Sustainability Advisory Committee, namely Susan Lindemann and Sara Stockwood.
Methods
The Sustainability Interns used SIMAP (Sustainability Indicator Management & Analysis Platform), a program created by The Sustainability Institute at the University of New Hampshire, to track, analyze, and visualize our Carbon data. To generate this report, first data had to be collected from various departments on campus. These included Facilities Management, Business, Center for International Programs, Composting, and Creative Dining. In the data collection and analysis process, several barriers inhibited access to complete information. The sustainability interns faced difficulties in determining which department had what data, getting timely responses from departments for information requests, and getting data in an appropriate format. Because of these difficulties, as well as a lack of proper record keeping in some cases, the sustainability interns had to make some assumptions when processing the data.
A large amount of the data needed to undergo some sort of conversion to ensure that the numbers were in a more usable form before inputting into SIMAP. Natural gas was converted from Mcf to mmBtu using a formula taken from the U.S. Energy Information Association (1 cubic foot = 1,036 Btu). Water waste was recorded from “Sewer – Linked” from water city bills, and converted from dollars to US gallons using the commodity rate of $0.465/m³ and the conversion rate of m³×264.2 gal. Solid waste was converted from “FY” (cubic yards) to tons by assuming that one cubic yard of loose waste equals 325 lbs, and dividing pounds by 2,000 lbs to get tons. It was also assumed that Republic Services is landfill waste for CH₄ Recovery and Electric Generation, and Best Way Disposal is landfill waste for CH₄ Recovery and Flaring. Lastly, paper was converted from sheets to reams using the assumptions that 500 sheets/1 ream of paper.
We also had to make some assumptions regarding the gas used for college vehicles. Because of the College’s contract suppliers with monthly billing, those that were filled by individual users could not be captured. With that, Business travel was not consistently tracked for this 2018-19 fiscal year. The interns used the data from the last time it was reported, in 2014, in the data analysis. Study Abroad travel data required the assumption that all participants were traveling from the same location which was not always the case. The student, staff, and faculty commuting data was collected through an online survey available on the Sustainability at K website, and emailed out by certain people and departments. This method of data collection assumes that surveying yields results that are representative of the campus community. It also assumes that students go to campus 36 weeks per year, faculty go to campus 45 weeks per year, and staff go 48 weeks per year. Lastly, it assumes that a block is 0.06 miles.
There were also some areas of collection that were skipped because it was deemed not possible to go back and retrieve data from 2018-2019. Business travel, Student Travel to/from Home, and Food were the main categories that, after trying to collect data for them for about half the year, the sustainability interns decided to either use historical data, which was the case for business travel, or simply not record anything for this time period, which was the case with food data since none ever became available. In terms of Student Travel to/from Home, the sustainability interns decided that they would not include this data because it would be unnecessarily difficult to record accurately and because, philosophically, they did not want the recruitment of students from far away to be considered an unsustainable practice.
Results
2018-2019 Kalamazoo College Carbon Emissions
Kalamazoo College’s Yearly Carbon Emissions
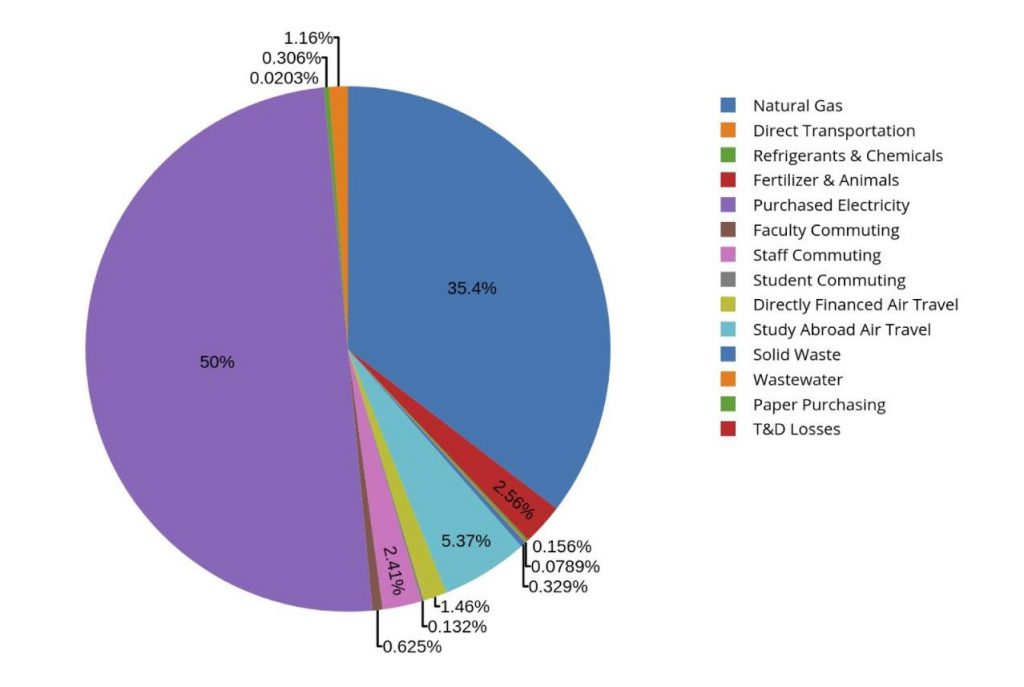
The top graph displays Kalamazoo College’s 2018-19 fiscal year carbon emissions, with each slice indicating the percent a source contributed to the total emissions. The two sources responsible for the largest carbon emissions were purchased electricity and natural gas.
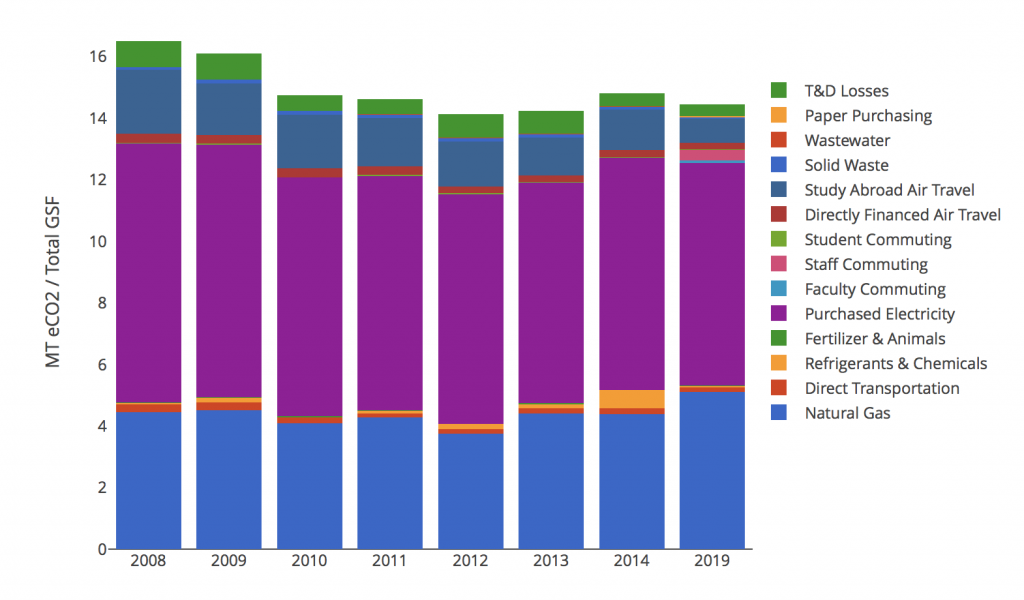
The bottom graph displays Kalamazoo College’s carbon emissions for the fiscal years 2008-2014, and 2019. The college did not report numbers for the years 2015-2018. The graph displays total carbon emitted per fiscal year as well as the amount each source contributed. The horizontal axis indicates metric tons of carbon dioxide per square footage. The net total metric ton of carbon dioxide emitted per square footage for the 2018-19 fiscal year was 14.44.
Discussion
The Climate Action Plan called for a reduction of greenhouse gas emissions by 25% of 2008 levels in 2020. The last reported emissions, in 2019, are 13% below the 2008 levels. The more modest reduction than planned is due to a few factors. First, a number of the strategies in the climate action plan did not come to fruition. These will be discussed in the updated plan in 2020. Furthermore, the jump of almost 1 metric ton of carbon dioxide per square footage from 2014 to 2019 for natural gas can be explained by the deterioration of the campus steam heating infrastructure that manifested as multiple leaks causing greater consumption of natural gas to maintain system pressure. Failing or inadequate zone controls also caused occupants to open windows in order to control heat. Lastly, the campus has added square footage since 2008, particularly the new field house and Arcus Center for Social Justice Leadership building which are heated using geothermal, and therefore consume a great amount of electricity to operate.
In addition to SIMAP, Kalamazoo College plans to utilize the Sustainability Tracking, Assessment & Rating System (STARS). STARS is another platform for colleges and universities to measure their sustainability performance. STARS is administered by the Association for the Advancement of Sustainable Higher Education, in collaboration with several higher education stakeholders. STARS rates colleges and universities according to their sustainability performance and provides benchmarking tools to compare institutions. Therefore, Kalamazoo College will utilize these benchmarking tools to compare our efforts with other colleges and universities and get on the STARS rating list.
In order to ensure consistent and accurate reporting in the future, an online data entry platform will be made available for inputting greenhouse gas emissions, sequestrations, and other relevant impacts of the college on the climate. The platform will be accessible through the Sustainability at K webpage, and will require all departments to input their data in a timely manner. With the introduction of an online data entry form, future Sustainability Interns will have the ability to spend less time focused on data collection and more time analyzing the results. Furthermore, it is a goal that future reports will collect data on areas not previously reported on, such as student travel to and from home, food, and gas card information.