
For the full, public report please view the Kalamazoo College Carbon Report submitted through The University of New Hampshire’s SIMAP carbon and nitrogen-accounting platform.
Introduction
The Kalamazoo College Sustainability and Climate Action Plan is a framework for imagining, measuring, and reducing Kalamazoo College’s greenhouse gas emissions and related climate consequences. Following President Wilson-Oyelaran’s signing of the American College & University Presidents Climate Commitment in 2007, the plan was drafted by committee, and signed in January 2010. It was a 28-month undertaking that began as a student-led initiative.
Interim goals for 2015 are included in the plan, but the ultimate goals are to have reduced greenhouse gas emissions from campus operations to 25% below 2008 levels by 2020, and to achieve complete carbon neutrality by 2050. The plan necessitates yearly tracking of our carbon data in order to determine if the College has met its objectives. The current Sustainability Intern for Facilities Management, William Fulton, as well as members of the Climate Action Plan Committee, Susan Lindemann and Sara Stockwood, worked to create this 2020-2021 carbon report.
Methods
To collect, analyze, and visualize our Carbon data, the Sustainability Interns used SIMAP (Sustainability Indicator Management & Analysis Platform), a platform developed by The Sustainability Institute at the University of New Hampshire. To create this report, data from several departments on campus needs to be gathered first. The Center for International Programs, Creative Dining, and Admissions were among the departments contacted. The Facilities Management department who is in charge of various sets of data including electricity, water, and composting plays a vital role in tracking our annual carbon emissions. These departments are all sent a monthly reminder email to log their data for the previous month. They do this via an online data entry form which consolidates the data into a spreadsheet that the Sustainability Interns and members of the Climate Action Plan Committee have access to.
Before entering the data into SIMAP, a major portion of the data has to be converted into a more usable format. A formula from the US Energy Information Association was used to convert natural gas from Mcf to mmBtu (1 cubic foot = 1,036 Btu). Water waste was recorded from water bills, and converted from dollars to US gallons using the commodity rate of $0.465/m³ and the conversion rate of 1m³ = 264.2 gal. By doing calculations for the month of January, we were able to assume every $2.50 spent on trash pickups was equal to 1 cubic yard of solid waste. By assuming that one cubic yard of loose garbage equals 325 lbs and dividing pounds by 2,000 lbs, solid waste was converted from “FY” (cubic yards) to tons. Best Way Disposal was assumed to be landfill waste for CH4 recovery and flaring. Paper data was converted from sheets to reams based on the notion that 500 sheets equal 1 ream.
Unfortunately, multiple datasets were not able to be retrieved for the 2020-2021 year. Due to the pandemic, there were too many factors to take into account to gather accurate data regarding the commuting practices of staff and students. There was a lack of information about what percentages of students, staff, and faculty were actually coming to campus and how often they were doing so. This was due to a lack of info surrounding how many classes were in-person, virtual, or a combination of both from COVID-19. For the 2020-2021 year there was no composting data and no new sequestration sinks. The last time data was collected for non-additional sequestration was the 2012-2013 year and this same value has been used for every year since then. Our goal is to update the carbon sequestration numbers every five years and the college’s Center for Environmental Stewardship is currently working on this calculation for the next academic year.
Results
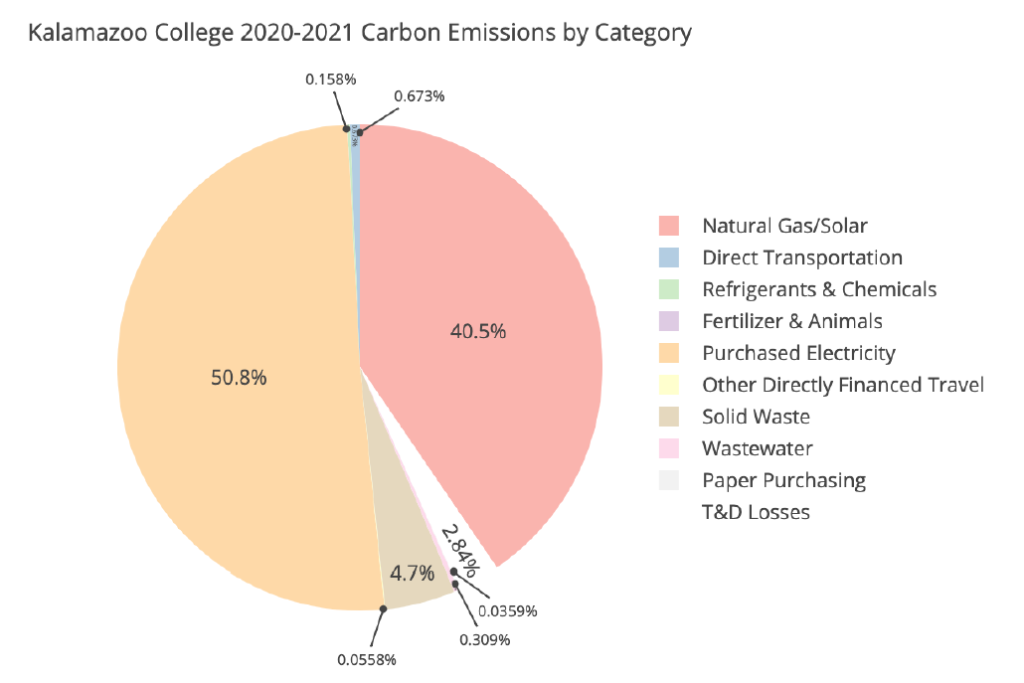
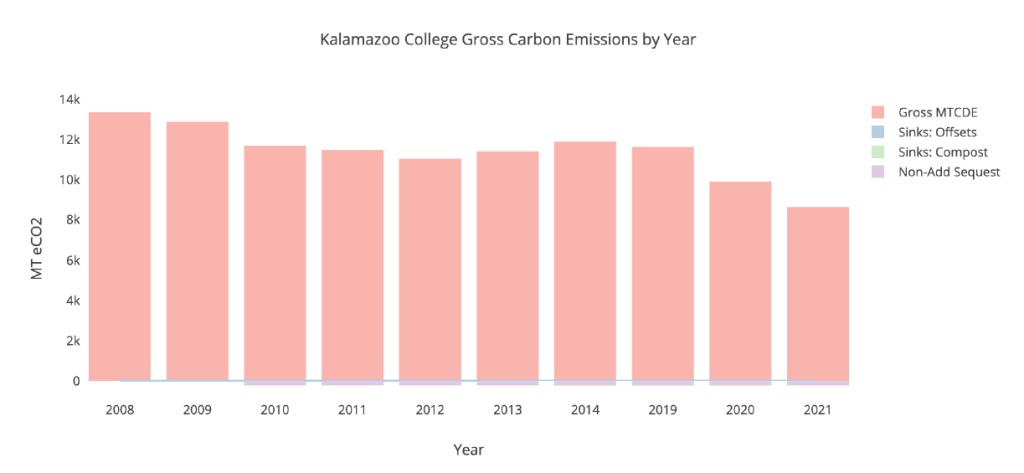
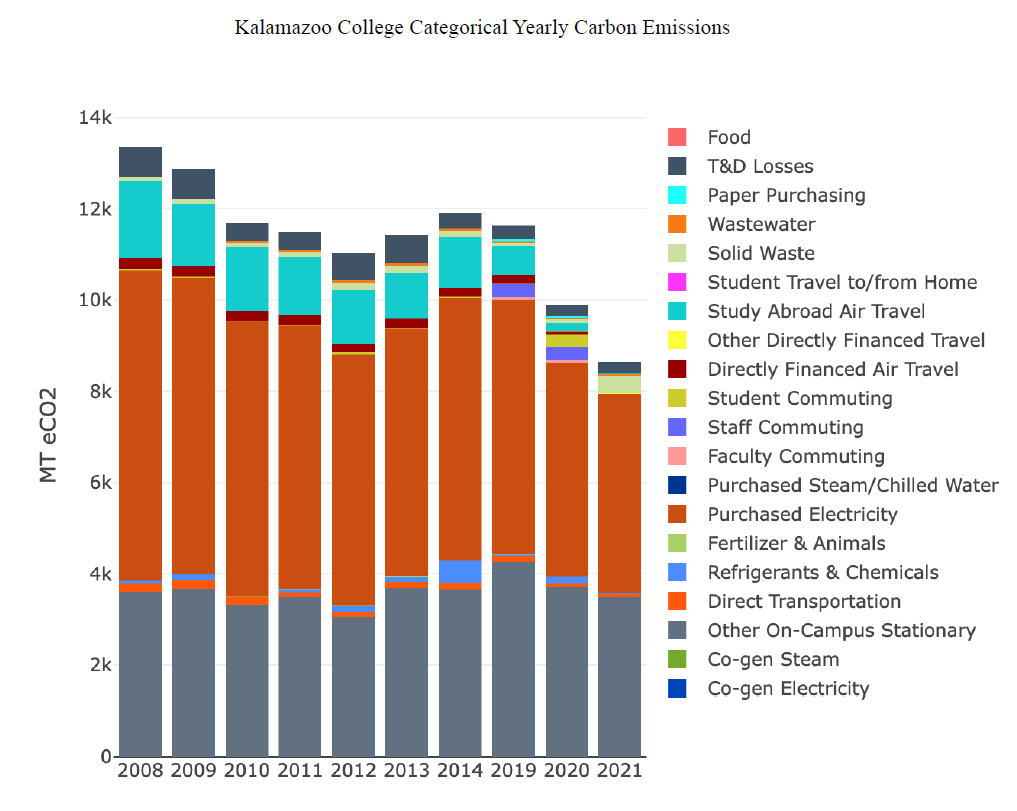
Figure 1 shows Kalamazoo College’s carbon emissions for the 2020-21 fiscal year, with each slice reflecting the percentage of total emissions generated by each source. Purchased electricity and natural gas were the two sources that contributed the most carbon emissions. This is consistent with all previous years as seen in Figure 3.
Figure 2, showing the gross carbon emissions per year helps us to visualize how we have improved throughout the years. We can also see the constant sequestration sink below the x-axis in purple. Kalamazoo College’s carbon emissions are shown for fiscal years 2008-2014 and 2019-2021 in Figures 2 and 3. For the years 2015-2018, the college did not provide any figures. The bottom graph shows the overall quantity of carbon emitted per fiscal year as well as the
contribution of each source. The vertical axis represents the amount of carbon dioxide in metric tons.
Discussion
The Climate Action Plan calls for a 25% reduction in greenhouse gas emissions compared to 2008 emissions by 2020. Figure 2 shows that this goal was met. With a gross carbon emission of 13,364.3 MTCDE (Metric Tons of Carbon Dioxide Emissions) in 2008 and a gross emission of 9.903.5 MTCDE in 2020, we observe a 25.8% reduction. The last reported emissions, in 2021, are observed to be 35% lower than in 2008 with a gross emission of 8,633.7 MTCDE. The global pandemic likely played an important role in the relatively low gross carbon emissions in 2021. With essentially all on-campus facilities operating at a lower frequency than usual during the pandemic, total carbon emissions were naturally lower than in normal years.
Figure 3 is extremely helpful in seeing how the pandemic affected the impact of different categories within the gross carbon emissions. In 2021, we can see that there was a significant increase in solid waste emissions and a significant decrease in emissions due to study abroad travel when compared to previous years. The increased level of solid waste in 2021 is likely due to the increase in paper and plastic packaging used by the College’s dining services during the pandemic. This included take-home food containers, cups, and large amounts of PPE (Personal Protective Equipment) worn by dining services staff members. A possible fix to this would be to offer some sort of returnable food container than can be taken home by students, used, and then returned either directly to the cafeteria or to designated spots on campus where they can be cleaned and reused. With very few students having the opportunity to study abroad during the pandemic time frame, we can see that there are almost no emissions due to study abroad travel in 2021.
In the reporting year of 2021, there were two causes that contributed to a rise in electricity and natural gas emissions as a percentage of the total emissions. The increased fresh air introduced into the building HVAC systems (to prevent virus transmission) undoubtedly increased our natural gas and power consumption. On top of this, construction of the College’s new natatorium was completed in 2021 and began using energy in the Spring of 2021. The building added 29,000 gsf (gross square feet) from the previous year, and once up and running, was particularly energy intensive due to heating/treating a large body of water and dehumidifying the space. Although there is no way to isolate the exact figures (how much each element caused things to go up or down), it’s clearly not a good year to use as an “ordinary” data point.
While the 35% decrease in emissions since 2008 is great and should be celebrated, it would not be surprising to see a slight rise in gross emissions in the next coming years as our campus returns to its normal state. Not only this, but since there were also certain categories that lacked data for 2020-21 due to the pandemic, as these areas succeed in collecting data for future years, the gross carbon emissions will likely see an increase.
Everyone can do their part to contribute to the Climate Action Plan. Whether you work in the CES (Center for Environmental Stewardship) or are just picking up litter as you see it around campus, this is a team effort that all students and staff should play a part in. Despite an expected increase in gross carbon emissions for the years following 2021, it is important that we remain at least 25% below 2008 emissions to keep previous goals met as we continue working towards complete carbon neutrality by 2050.