Kalamazoo College’s carbon emissions data has been published for the fiscal year (FY) 2022. The College utilizes SIMAP to report our carbon data, which is the Sustainability Indicator Management and Analysis Program run through the University of New Hampshire.
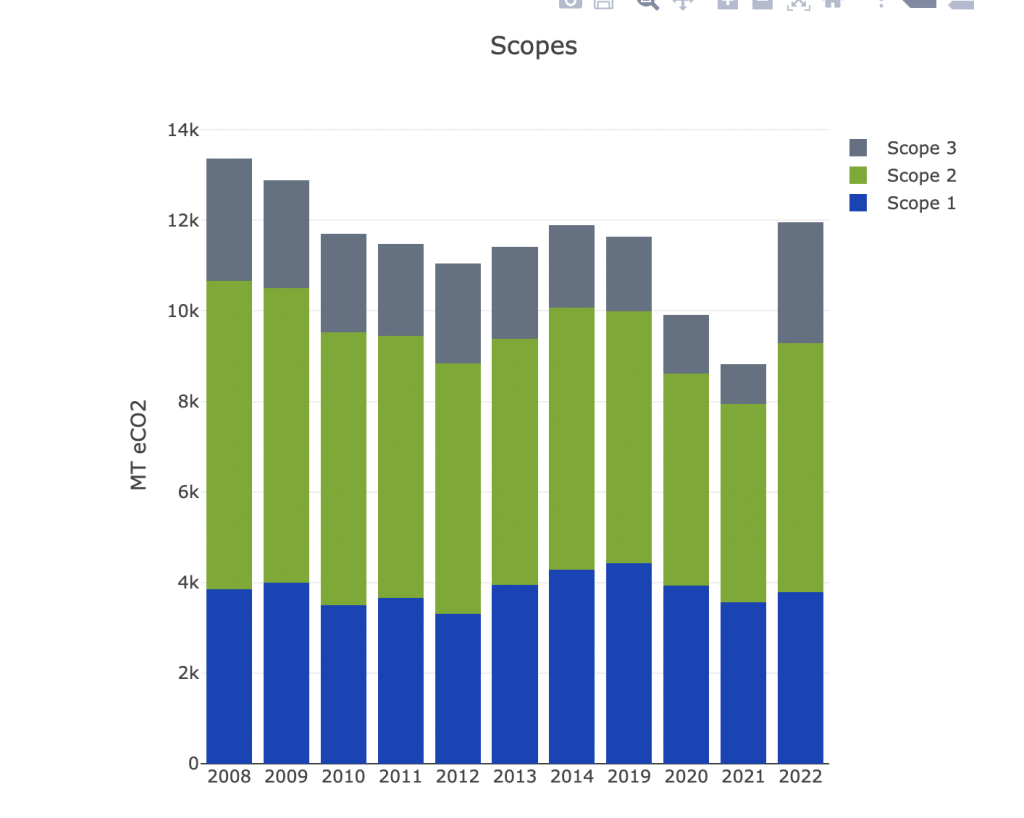
The SIMAP data shows the total carbon footprint of our campus, through a variety of measures. Some of those measures are called scopes.
- Scope 1 = Fuels and other “direct” fossil fuels, like refrigerants and natural gas
- Scope 2 = Indirect fossil fuels, such as electricity and renewable energy
- Scope 3 = Energy usage that’s harder to connect to fossil fuels, including business travel, commuting, and waste
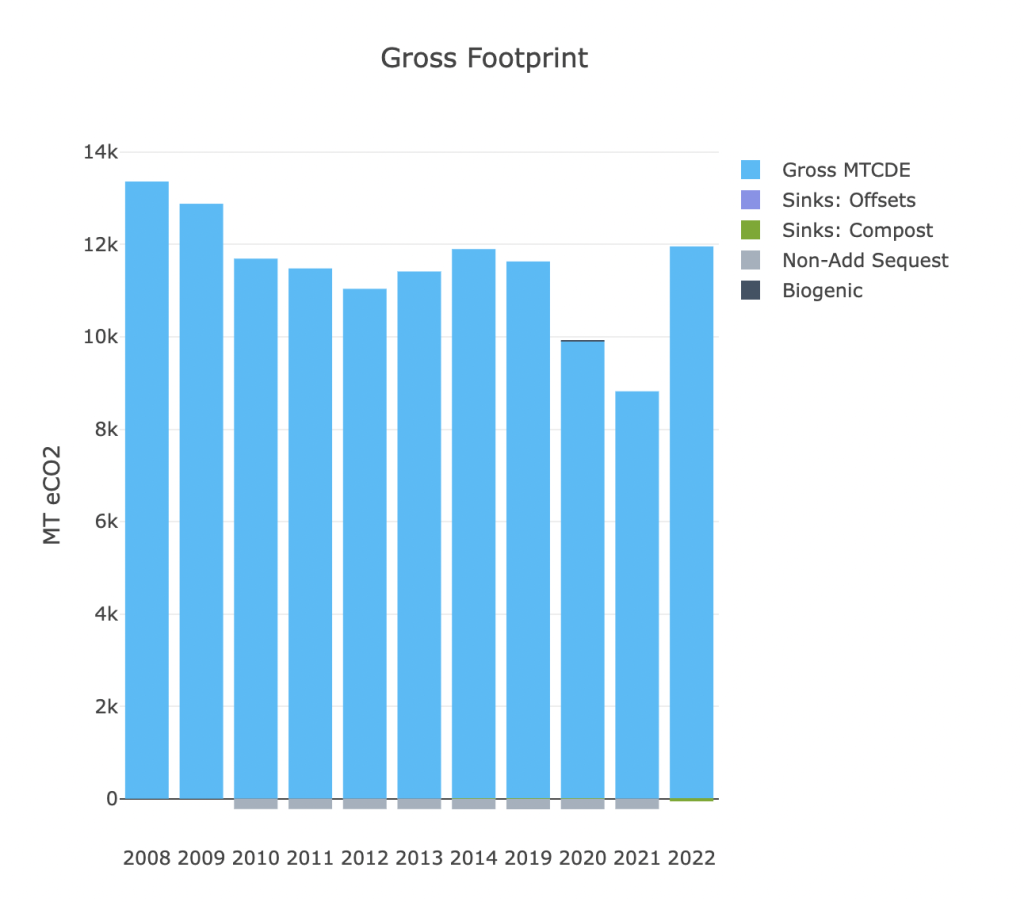
Other measures include “sinks” which sequester carbon, like our compost; other factors to account for are the number of people on campus, and our total square footage.
One initial result that seems apparent in our SIMAP data is that our carbon emissions actually increased across this reporting year – and while it’s a good thing to be concerned about this pattern, it’s also worth taking a deep dive into. Several things happened across FY 2022 that could account for that increase:
- Our new natatorium went online – that’s 500,000 gallons of water that needs to be heated, and air that needs to be dehumidified; overall, the natatorium was a 6% increase in square footage! That’s a lot of energy!
- The pandemic conditions required increased airflow in buildings, and for filters to protect against viruses; these things made the airflow motors work harder, exerting more energy.
- The measure of our carbon footprint is based on a standard set in 2008 – but since then, we’ve started to increase our reporting in an effort to be more honest and thorough regarding energy use on campus. No wonder we’re seeing more energy use, if we’re documenting more in the first place!
Even taking into account all of these energy-intensive changes, the college still made a 20% reduction in total carbon footprint from our original standard. Normalizing the data for square feet (and accounting for the 30,000sqft energy-intensive natatorium going online) reveals that we made a footprint reduction by 25%.
As campus life goes on, and as we continue to measure our carbon emissions thoroughly, we can look forward to a growing understanding of our campus’s carbon footprint. In FY 2023, when the pandemic has slowed, we can most likely look forward to a decrease in emissions, and a continued path towards sustainable living.
Special thanks to Susan Lindemann (Chief Sustainability Officer, VP of Facilities Management) for her work with SIMAP and her time spent explaining the nuances of this year’s report.